RFSIM: A Feature Based Image Quality Assessment Metric Using Riesz Transforms
Authors
- Lin Zhang, SSE, Tongji University
- Lei Zhang, Dept. Computing, HK Polytechnic University, Hong Kong
- Xuanqin Mou, Institute of Pattern Recognition and Image Processing, Xi'an JiaoTong University, China
Abstract
As a fundamental problem in image/video processing and vision, image quality assessment (IQA) aims to provide computational models to measure the image quality in a perceptually consistent manner. In this paper, a novel feature based IQA model, namely Riesz-transform based Feature SIMilarity metric (RFSIM), is proposed based on the fact that the human vision system (HVS) perceives an image mainly according to its low-level features. The 1st-order and 2nd-order Riesz transform coefficients of the image are taken as image features, while a feature mask is defined as the edge locations of the image. The similarity index between the reference and distorted images is measured by comparing the two feature maps at key locations marked by the feature mask. Extensive experiments on the comprehensive TID2008 database indicate that the proposed RFSIM metric is more consistent with the subjective evaluation than all the other competing methods evaluated, including the well-known MS-SSIM and VIF, etc.
Algorithm
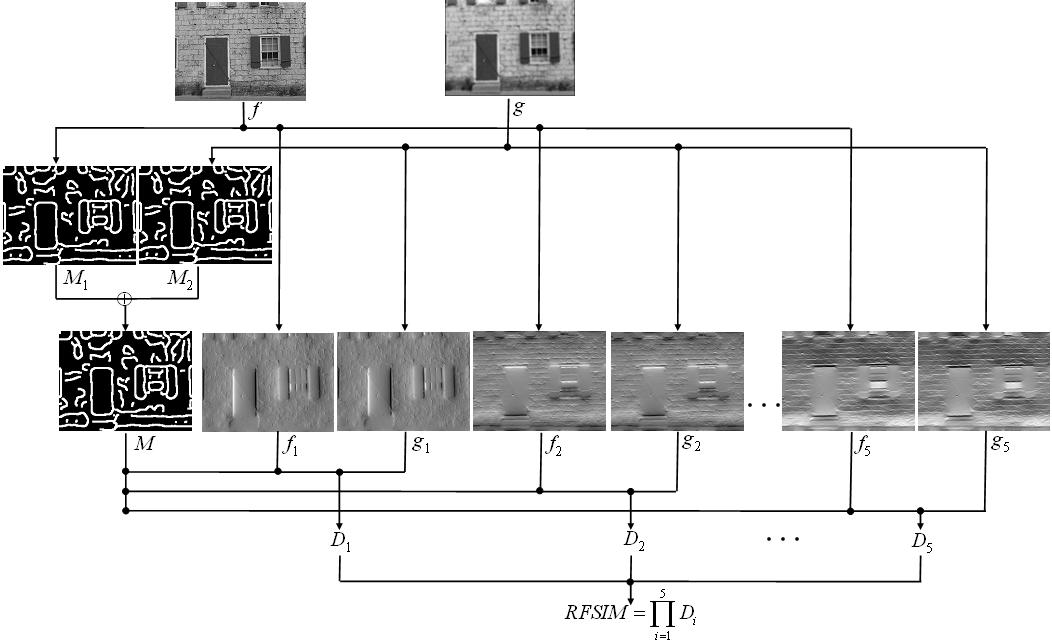
With the belief that the perceptible image degradations will induce perceived changes in image features at key locations, we present a novel IQA model, namely Riesz-transform based Feature SIMilarity index (RFSIM). It is computed by comparing the feature maps at key locations marked by a feature mask between two images.
Considering the fact that HVS is sensitive to image edges, key locations are marked by a feature mask which is simply generated by a Canny operator without thinning operation. Suppose that we are going to calculate the similarity between two images f and g. Denote by M1 the result of Canny edge detection performed on f, and M2 the result of Canny edge detection on g. Then, the feature mask is defined as M = M1 OR M2
The 1st-order and the 2nd-order
Riesz transforms can extract some low-level image features effectively and
efficiently in a unified theoretic framework. Thus, in this paper, we utilize
them for the feature extraction. However, we do not extract the features such as
the local phase, local orientation and local surface type, etc., explicitly.
Instead, we take the coefficients of the Riesz transforms as features directly.
Let f1, f2, f3,
f4, f5 represent
Rx
Validation
We conduct experiments on the TID2008 database, which is the largest database for the evaluation of full reference IQA models. We compare the performance of the proposed RFSIM metric with seven state-of-the-art IQA metrics, including SSIM, MS-SSIM, VIF, VSNR, IFC, VIFp, and NQM. For the implementation of the compared IQA metrics, we use the publicly available software in http://foulard.ece.cornell.edu/gaubatz/metrix_mux/.
In order to evaluate the IQA models, four commonly used performance metrics are employed. The first two metrics are the Spearman rank-order correlation coefficient (SROCC) and the Kendall rank-order correlation coefficient (KROCC), which can measure the prediction monotonicity of an IQA model. To compute the third and the fourth metrics we need to apply a regression analysis, as suggested by the video quality experts group (VQEG), to provide a nonlinear mapping between the objective scores and the subjective mean opinion scores (MOS). The third metric is the Pearson linear correlation coefficient (CC) between MOS and the objective scores after nonlinear regression. The fourth metric is the root mean square error (RMSE) between MOS and the objective scores after nonlinear regression. For the nonlinear regression analysis, we use the following mapping function: f(x) = β1(0.5 - 1/(1 + exp(β2(x - β3)))) + β4x + β5. The performance comparison of the eight IQA models on the TID2008 database is given in the following table. We can clearly see that the proposed RFSIM model performs much better than all the other seven methods evaluated in terms of all the four evaluation metrics.
|
Model |
SROCC |
KROCC |
CC |
RMSE |
|
RFSIM |
0.8680 |
0.6780 |
0.8645 |
0.6746 |
|
MS-SSIM |
0.8528 |
0.6543 |
0.8425 |
0.7229 |
|
SSIM |
0.7749 |
0.5768 |
0.7732 |
0.8511 |
|
VIF |
0.7496 |
0.5863 |
0.8090 |
0.7888 |
|
VSNR |
0.7046 |
0.5340 |
0.6820 |
0.9815 |
|
IFC |
0.5692 |
0.4261 |
0.7359 |
0.9086 |
|
VIFp |
0.6546 |
0.4952 |
0.7702 |
0.8559 |
|
NQM |
0.6243 |
0.4608 |
0.6135 |
1.0598 |
Reference
Lin Zhang, Lei Zhang, and Xuanqin Mou, "RFSIM: a feature based image quality assessment metric using Riesz transforms", in: Proc. ICIP, pp. 321-324, 2010.